RSI Deep Dive: What 25 Years of SPY Data Actually Tells Us
A comprehensive analysis of RSI mean reversion strategies and forward returns using SPY data from 2000-2025. Discover what extreme RSI levels really predict.
Introduction
The Relative Strength Index (RSI) is one of the most popular technical indicators in trading. The conventional wisdom is simple: buy when RSI drops below 30 (oversold), sell when it rises above 70 (overbought). But does this actually work?
I analyzed 25 years of SPY data (2000-2025) to find out. Instead of relying on theoretical claims, I tested actual trading strategies and examined what extreme RSI values predict about future returns and volatility.
In this article, you'll discover:
- Real backtest results for RSI mean reversion strategies (both long and short)
- What different RSI levels predict about forward 5-day returns
- How RSI relates to future volatility
- Whether extreme RSI readings actually present trading opportunities
Let's dive into the data.
What is RSI?
The Relative Strength Index (RSI) is a momentum oscillator that measures the speed and magnitude of price changes. It ranges from 0 to 100, with values:
- Below 30 traditionally considered "oversold" (potential buying opportunity)
- Above 70 traditionally considered "overbought" (potential selling opportunity)
Here's the calculation:
Average Gain = (Sum of Gains over n periods) / n
Average Loss = (Sum of Losses over n periods) / n

RS = Average Gain / Average Loss

RSI = 100 - (100 / (1 + RS))
where n is the lookback period (typically 14 days), and gains/losses are calculated from daily price changes.
The RSI formula compares the average gains to average losses over a specified period (typically 14 days). When gains outpace losses, RSI rises. When losses dominate, RSI falls.
The Dataset
I analyzed SPY (S&P 500 ETF) from January 2000 to December 2025. This 25-year period includes:
- The dot-com crash (2000-2002)
- The financial crisis (2007-2009)
- Multiple corrections and bear markets
- The COVID-19 crash and recovery (2020)
- Recent market volatility (2022-2023)
Total trading days analyzed: 6,521 days
This dataset captures multiple market cycles, making the results more robust than short-term analyses.
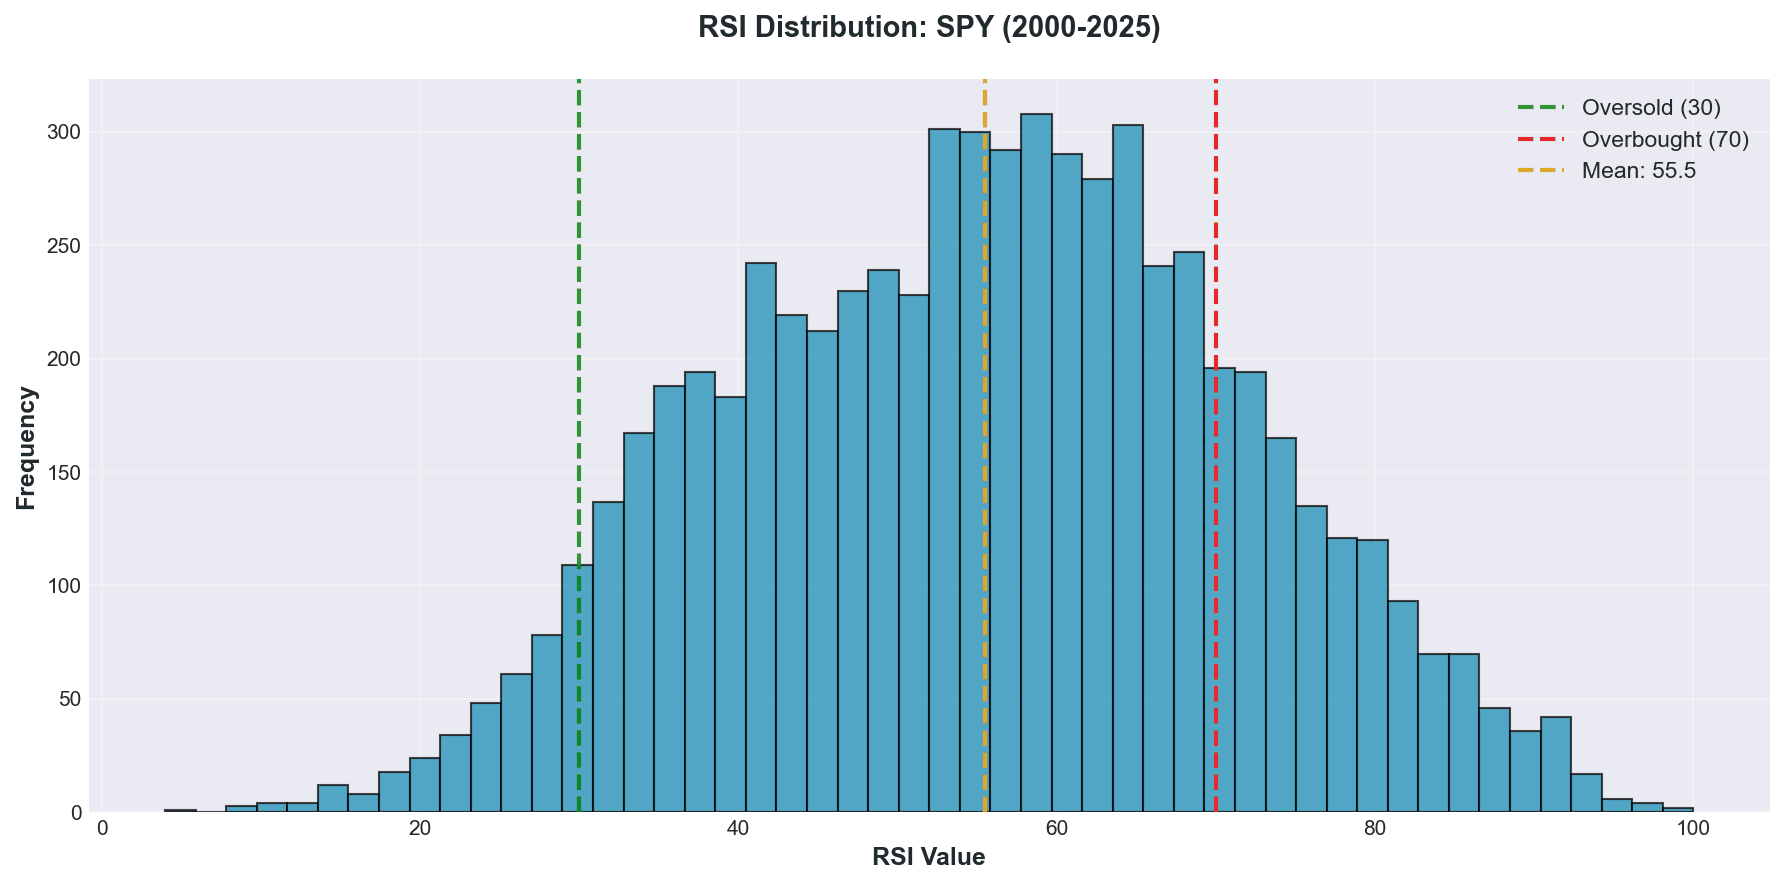
The distribution shows that RSI spends most of its time in the 40-70 range. Extreme readings (below 30 or above 70) are relatively rare, which is important for understanding strategy performance.
Strategy 1: Long Mean Reversion (Buy Oversold, Sell at Recovery)
Strategy Rules
- Entry: Buy when RSI crosses below 30
- Exit: Sell when RSI crosses above 50
- Position: Only 1 trade at a time (no re-buying while RSI stays below 30)
Results
| Metric | Value |
|---|---|
| Total Trades | 80 |
| Win Rate | 71.25% |
| Average Return per Trade | 0.94% |
| Median Return per Trade | 1.36% |
| Best Trade | +15.73% |
| Worst Trade | -20.15% |
| Average Holding Period | 20.6 days |
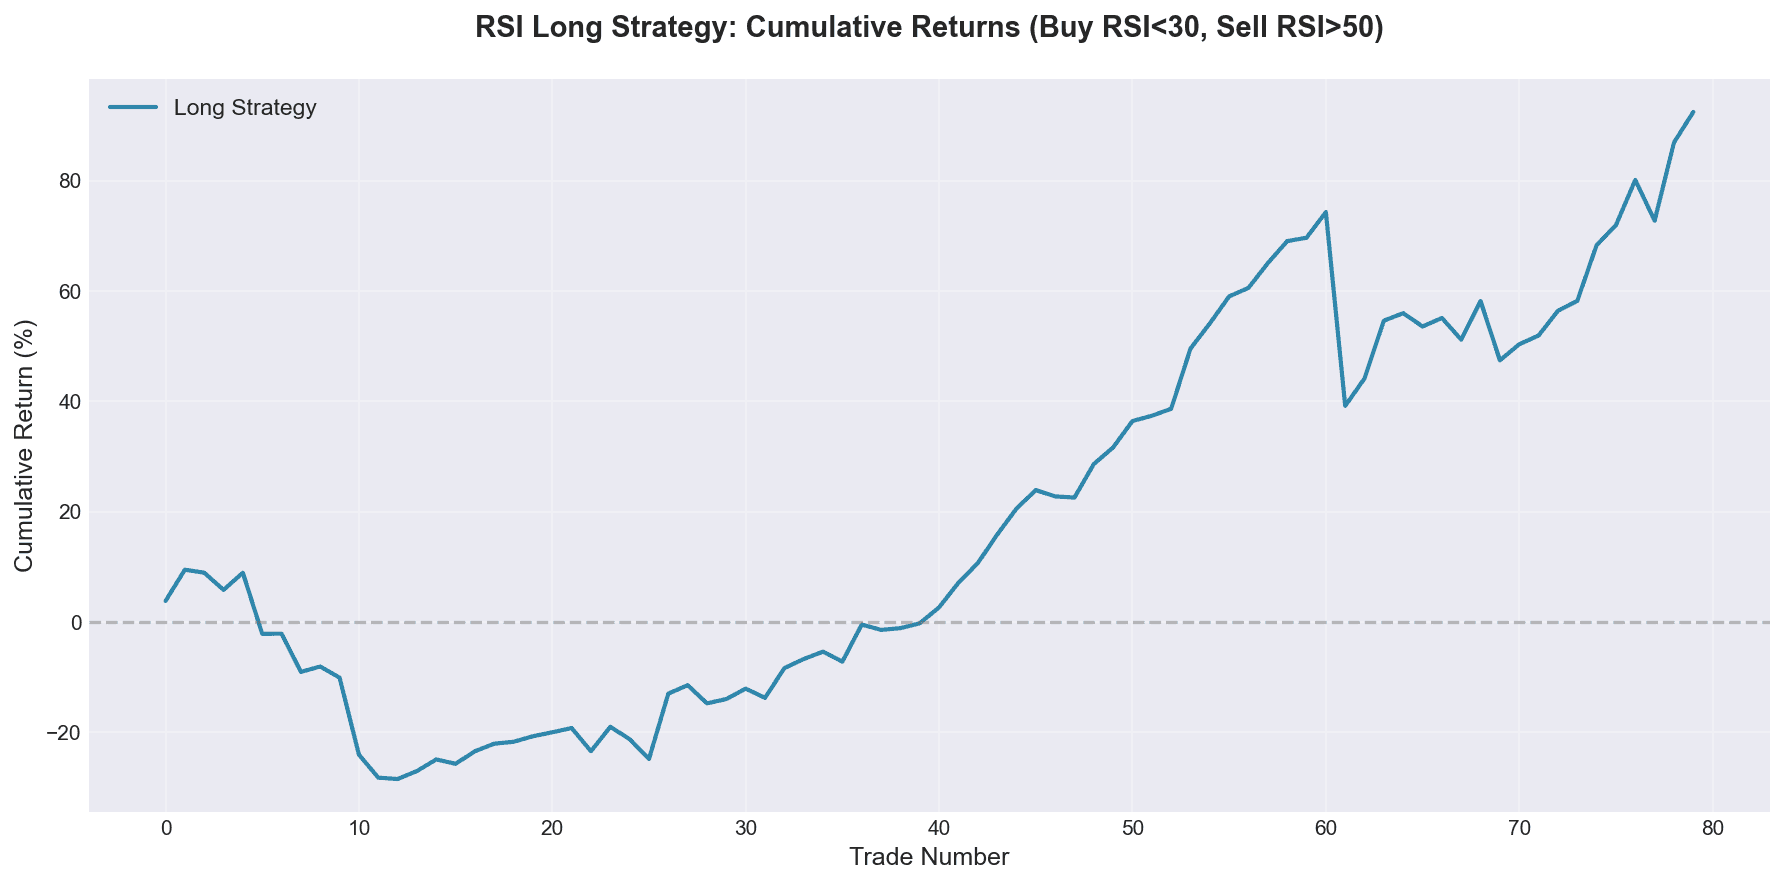
| Total Cumulative Return | 75.50% |
Key Insights
The long mean reversion strategy shows positive results with a 71% win rate. This aligns with the idea that extreme oversold conditions in SPY (a diversified index) tend to reverse.
However, several important caveats:
-
Low Frequency: Only 80 trades over 25 years means about 3 trades per year. This isn't a high-frequency strategy.
-
Significant Drawdowns: The worst trade lost 20%, highlighting that "oversold can get more oversold." The 2008 financial crisis, for example, saw repeated RSI readings below 30 with continued declines.
-
Holding Period: The average 20-day holding period means you're not quickly in and out. You need patience for the mean reversion to play out.
-
Cumulative Performance: The 75% total return over 25 years (not annualized) is modest compared to buy-and-hold SPY, which returned approximately 400% over the same period.
Strategy 2: Short Mean Reversion (Short Overbought, Cover at Weakness)
Strategy Rules
- Entry: Short when RSI crosses above 70
- Exit: Cover when RSI crosses below 50
- Position: Only 1 trade at a time
Results
| Metric | Value |
|---|---|
| Total Trades | 128 |
| Win Rate | 58.59% |
| Average Return per Trade | -0.32% |
| Median Return per Trade | 0.39% |
| Best Trade | +8.69% |
| Worst Trade | -11.65% |
| Average Holding Period | 27.6 days |
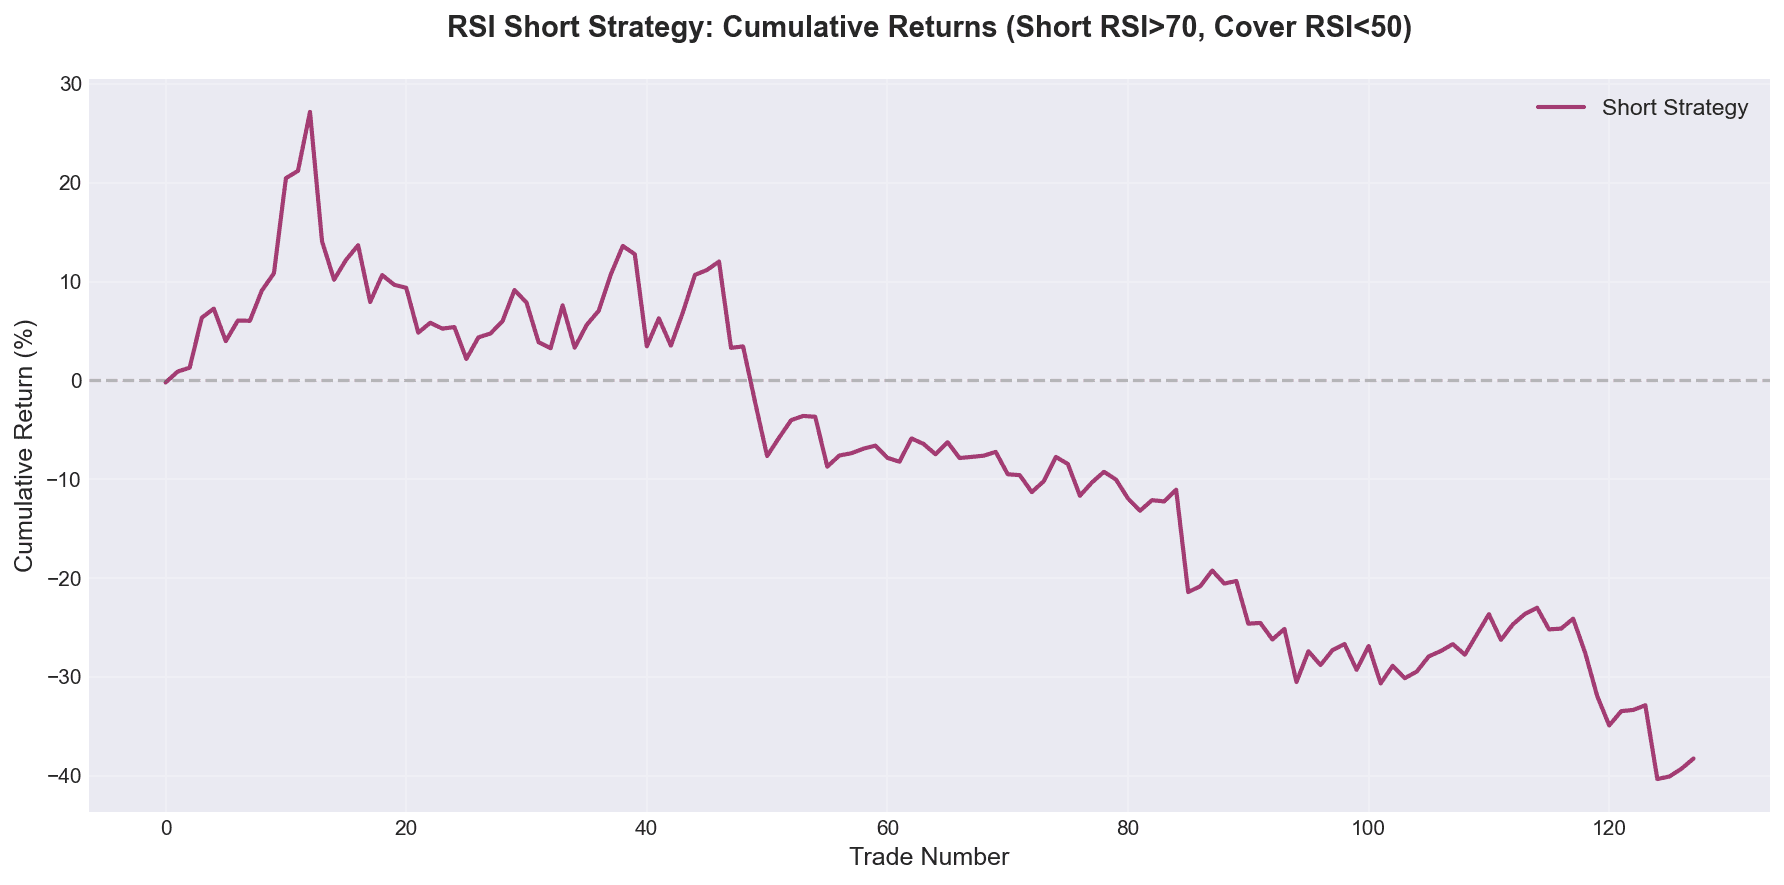
| Total Cumulative Return | -41.35% |
Key Insights
The short strategy shows negative results overall, despite a 58% win rate. This reveals a critical truth about shorting indices:
-
Upward Bias: SPY has a long-term upward trend. Shorting overbought conditions fights this trend, leading to larger losses when wrong.
-
Average vs. Median: The median return (0.39%) is positive, but the average (-0.32%) is negative. This means the losses are larger than the wins, creating a negative expectancy.
-
More Frequent: 128 trades vs. 80 for the long strategy shows that overbought conditions occur more frequently in bull markets.
-
Longer Holding: The 27.6-day average holding period is longer than the long strategy, indicating that overbought conditions can persist longer than oversold ones in a rising market.
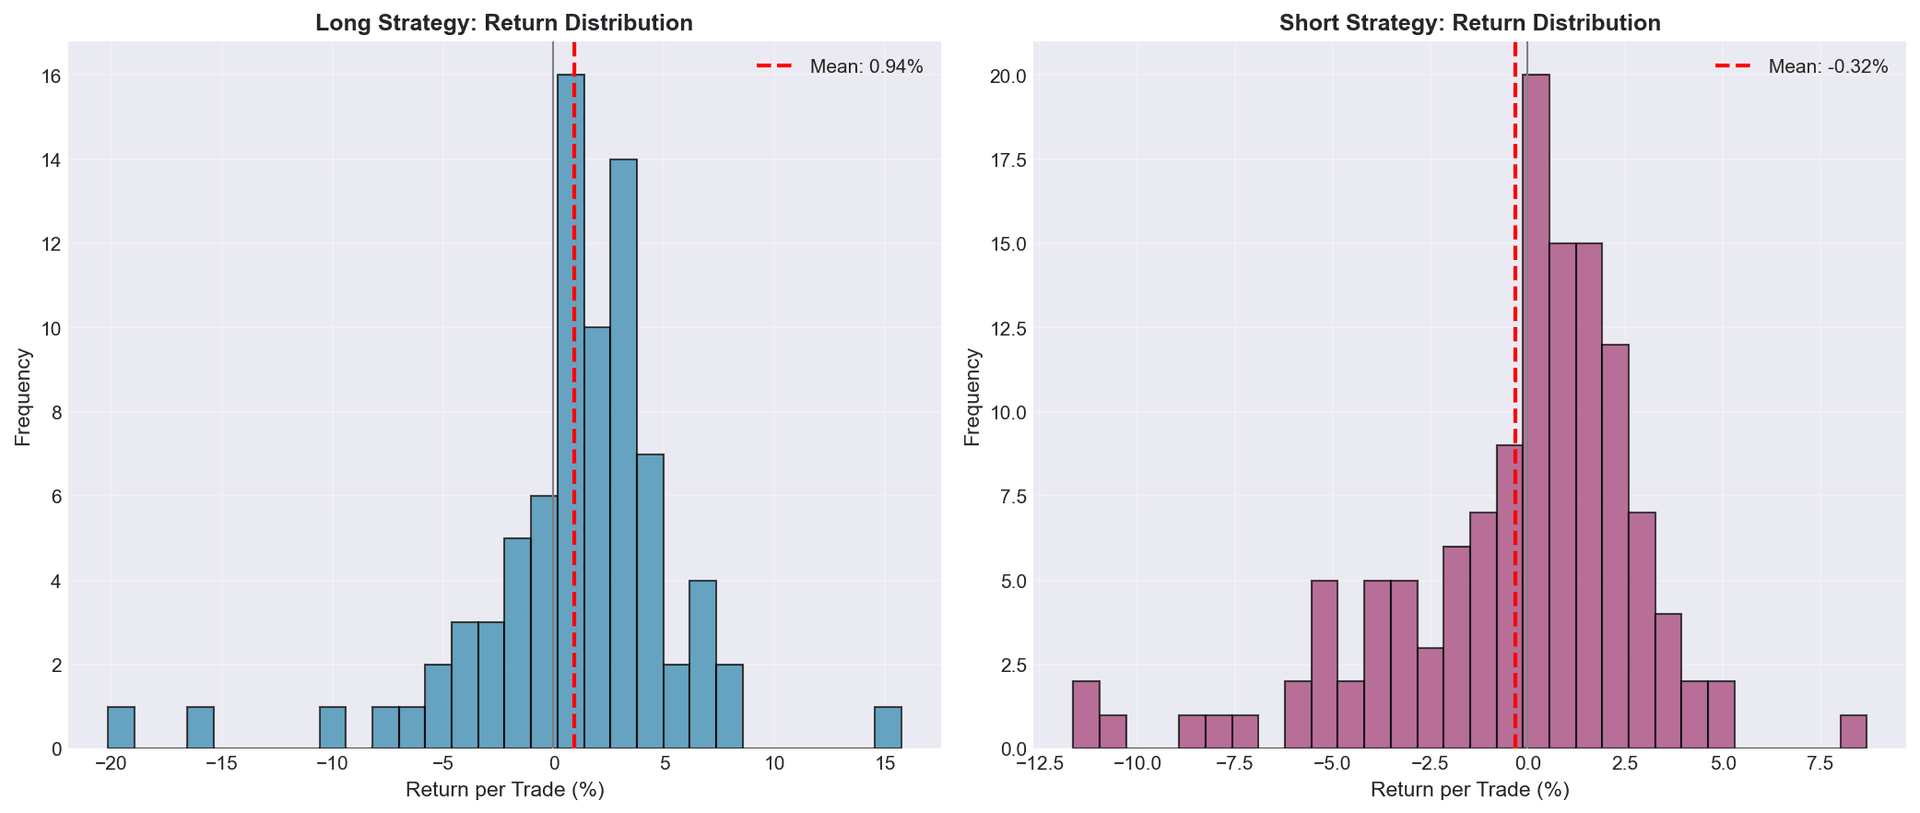
The distribution charts show that the long strategy has a wider right tail (bigger winners), while the short strategy has a wider left tail (bigger losers).
What RSI Levels Predict About Future Returns
I analyzed the forward 5-day returns based on current RSI levels. Here's what I found:
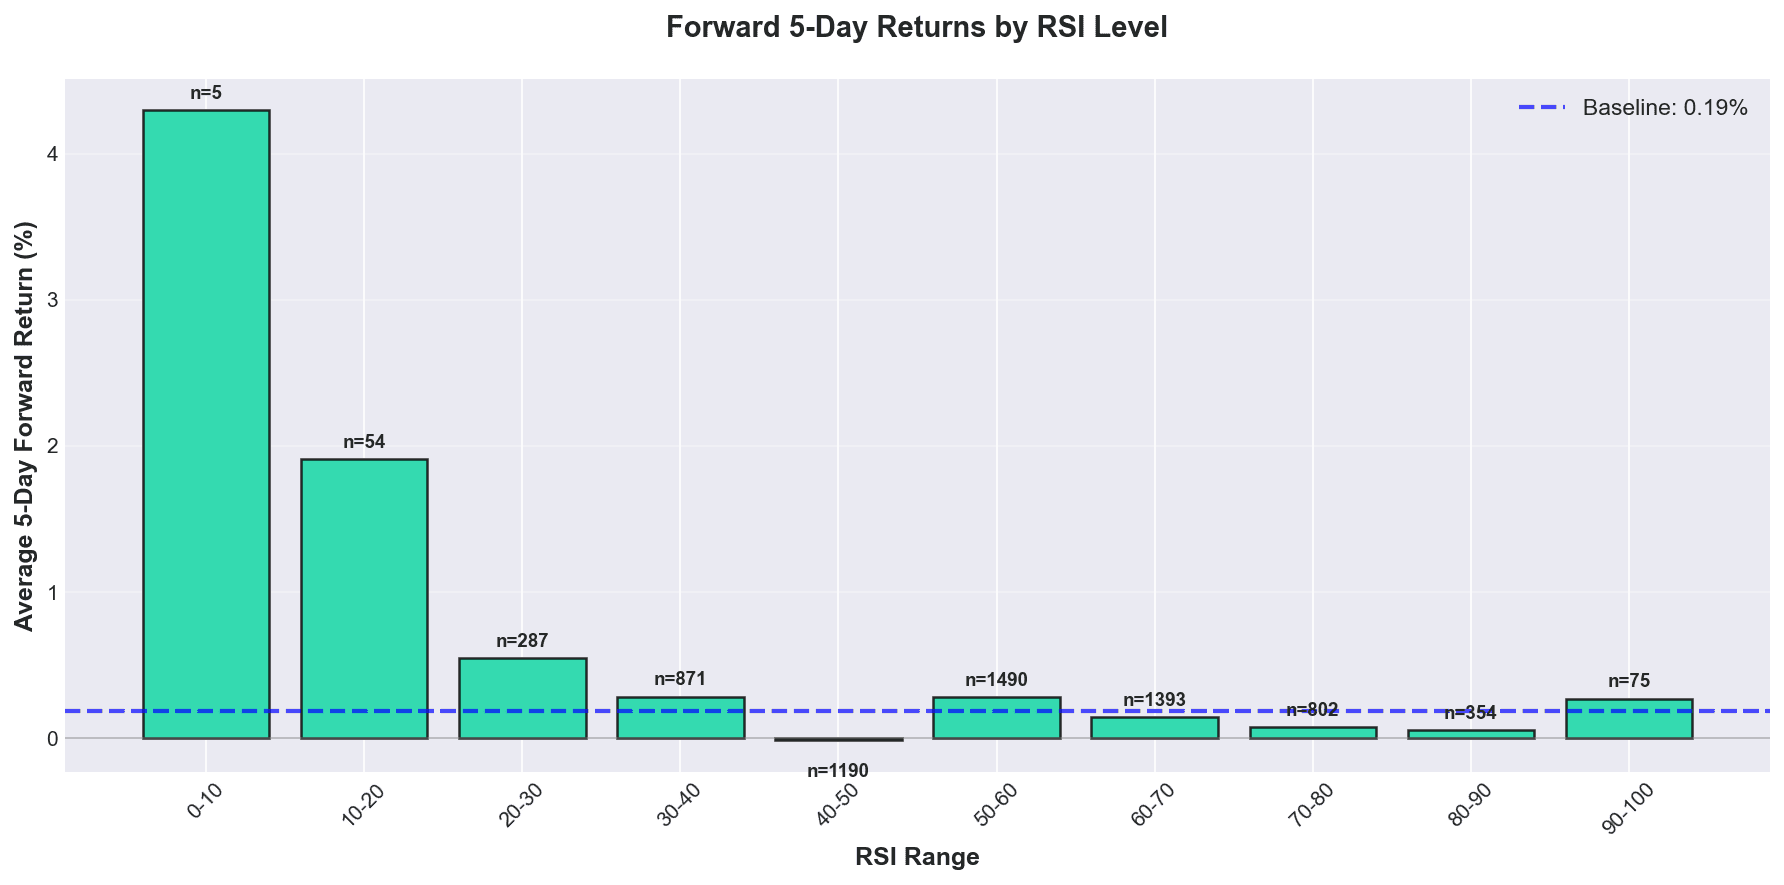
| RSI Range | Avg 5-Day Return | Occurrences |
|---|---|---|
| 0-10 | +4.30% | 5 |
| 10-20 | +1.91% | 54 |
| 20-30 | +0.55% | 287 |
| 30-40 | +0.28% | 871 |
| 40-50 | -0.02% | 1,190 |
| 50-60 | +0.28% | 1,490 |
| 60-70 | +0.14% | 1,393 |
| 70-80 | +0.08% | 802 |
| 80-90 | +0.06% | 354 |
| 90-100 | +0.27% | 75 |
Baseline (random day): +0.19% average 5-day return
Key Findings
-
Extreme Oversold is Powerful: RSI below 20 shows dramatically higher forward returns. The RSI 0-10 bucket (only 5 occurrences) shows a massive +4.3% average 5-day return.
-
Mild Oversold Still Works: Even the RSI 20-30 range shows above-average returns, validating the mean reversion concept.
-
Middle Range is Neutral: RSI between 40-60 shows returns close to the baseline. No edge here.
-
Overbought is Only Slightly Negative: RSI 70-90 shows slightly below-average returns, but the effect is much weaker than the oversold signal.
-
Extreme Overbought Reverses: Interestingly, RSI 90-100 shows positive returns again, possibly because these extreme readings often occur during strong trends that continue.
What RSI Levels Predict About Future Volatility
Beyond returns, I analyzed how RSI relates to future volatility (5-day standard deviation):
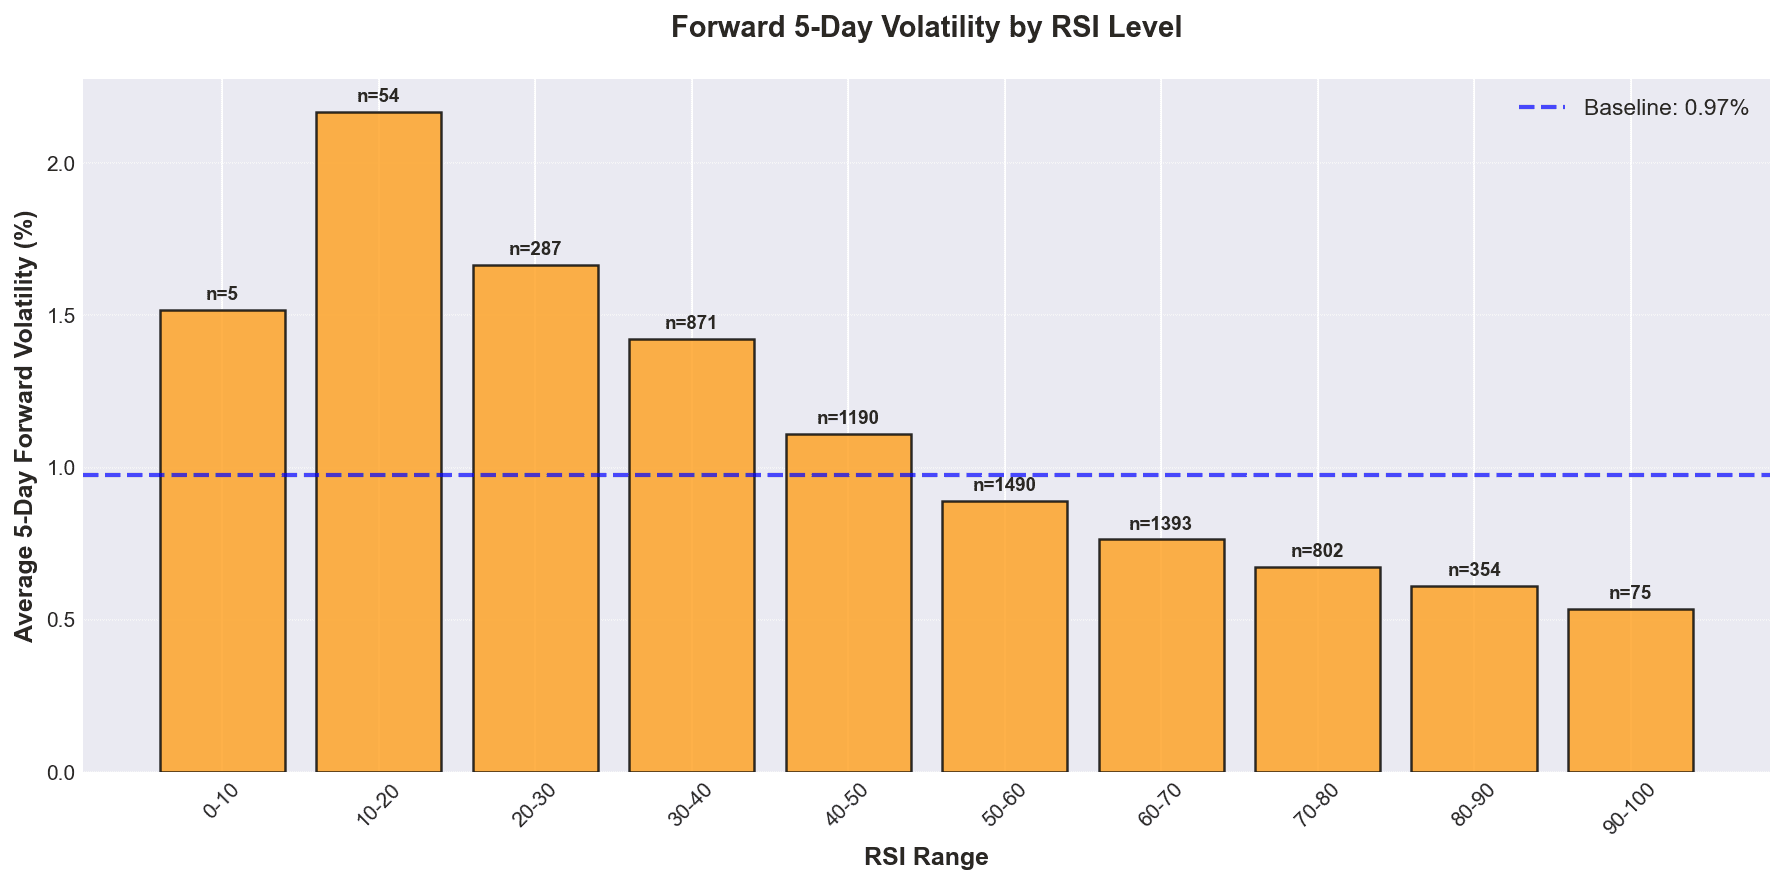
| RSI Range | Avg 5-Day Volatility |
|---|---|
| 0-10 | 1.52% |
| 10-20 | 2.17% |
| 20-30 | 1.67% |
| 30-40 | 1.42% |
| 40-50 | 1.11% |
| 50-60 | 0.89% |
| 60-70 | 0.76% |
| 70-80 | 0.68% |
| 80-90 | 0.61% |
| 90-100 | 0.54% |
Baseline (random day): 0.98% average 5-day volatility
Key Findings
-
Oversold = High Volatility: Extremely low RSI readings predict significantly higher future volatility. This makes sense—panic selling creates volatility.
-
Overbought = Low Volatility: High RSI readings predict lower future volatility, suggesting calmer, grinding upward movements.
-
Clear Gradient: There's a nearly perfect inverse relationship between RSI and future volatility. The lower the RSI, the higher the expected volatility.
-
Risk Management Implications: This finding is crucial for position sizing. When buying oversold conditions, expect higher volatility and size accordingly.
Practical Implications for Traders
What Works
-
Buying Extreme Oversold: RSI below 30 in SPY offers a statistical edge for mean reversion trades. The more extreme, the better (RSI < 20 is particularly strong).
-
Patience Required: The average holding period is 20+ days. This isn't day trading—you need to let mean reversion play out.
-
Index-Specific: These results are for SPY, a diversified index with long-term upward drift. Individual stocks may behave differently.
What Doesn't Work
-
Shorting Overbought: The short strategy lost money overall. Fighting the upward trend of indices is difficult.
-
Trading Mild Signals: RSI in the 30-40 or 60-70 ranges shows only modest edges. Focus on extreme readings.
-
Expecting Consistency: Even with a 71% win rate, you'll face significant drawdowns. The worst long trade lost 20%.
Position Sizing Considerations
Given the volatility analysis:
- Reduce size when buying RSI < 20 (expect 1.5-2x normal volatility)
- Don't oversize just because RSI is at extremes
- Account for holding periods of 2-4 weeks
When RSI Fails
RSI mean reversion fails during:
- Structural bear markets (2008, early 2020): Oversold becomes more oversold
- Trend changes: When bullish trends break, overbought becomes the new normal
- Low liquidity events: Flash crashes can create extreme RSI readings that continue
How to Implement This on Backtest4U
You can test these exact strategies on Backtest4U using the rule builder:
Long Strategy:
Buy Condition: rsi(14) < 30
Sell Condition: rsi(14) > 50
Short Strategy:
Buy Condition: rsi(14) > 70
Sell Condition: rsi(14) < 50
Try variations:
- Different RSI periods (10, 14, 20)
- Different entry thresholds (25, 30, 35)
- Different exit strategies (fixed profit targets, trailing stops)
- Combining RSI with other indicators (price above/below moving averages)
Key Takeaways
-
Oversold signals work: RSI below 30 in SPY offers a legitimate mean reversion edge, with lower RSI values showing stronger forward returns.
-
Overbought signals are weak: Shorting overbought conditions in indices is unprofitable due to upward market drift.
-
Extreme readings matter most: The edge exists primarily at RSI extremes (< 20 or > 80), not in mild readings.
-
Volatility increases with oversold: Lower RSI predicts higher future volatility, requiring careful position sizing.
-
Low frequency strategy: Only 3-5 setups per year means this should complement, not replace, other strategies.
-
Context matters: RSI mean reversion works better in bull markets with temporary pullbacks than in structural bear markets.
Conclusion
After analyzing 25 years of data and over 6,500 trading days, the verdict is clear: RSI mean reversion has a statistical edge for buying oversold conditions in SPY, but shorting overbought conditions does not work.
The most important finding is that extreme matters. RSI below 20 offers dramatically better forward returns than RSI between 30-40. Similarly, the volatility relationship is strongest at extremes.
If you want to trade RSI mean reversion:
- Focus on extreme oversold readings (RSI < 25)
- Be patient with 2-4 week holding periods
- Size positions to account for higher volatility
- Avoid shorting overbought conditions in indices
- Always backtest your specific strategy parameters
Ready to test your own RSI strategy? Try it on Backtest4U with 25+ years of historical data and see how your variations perform.