Moving Average Crossover: Testing 190 Strategies on 25 Years of Data
Comprehensive analysis of moving average crossover strategies on SPY (2000-2025). We test 190 MA combinations to find what actually works and why most fail.
Introduction
The moving average crossover is one of the most famous trading strategies. The concept is simple: buy when a fast-moving average crosses above a slow-moving average, sell when it crosses below.
The most celebrated version is the "Golden Cross" - the 50-day MA crossing above the 200-day. But does it actually work?
I tested 190 different MA combinations on 25 years of SPY data (2000-2025) to find out.
How Moving Average Crossovers Work
A moving average (MA) smooths price data by averaging prices over a period. A 50-day MA averages the last 50 days of closing prices.
The strategy:
- Calculate two moving averages: a fast one (shorter period) and a slow one (longer period)
- Buy signal: When the fast MA crosses above the slow MA
- Sell signal: When the fast MA crosses below the slow MA
When short-term momentum exceeds long-term momentum, prices are trending up. When it reverses, the trend is changing.
The Golden Cross (50/200)
The most famous combination: 50-day MA vs 200-day MA.
Results on SPY (2000-2025):
| Metric | Value |
|---|---|
| Total Trades | 12 |
| Average Return per Trade | 19.79% |
| Win Rate | 75.0% |
| Total Return | 643.94% |
Over 25 years, just 12 trades generated a 644% return vs buy-and-hold's 532%. That's a 112-point outperformance.
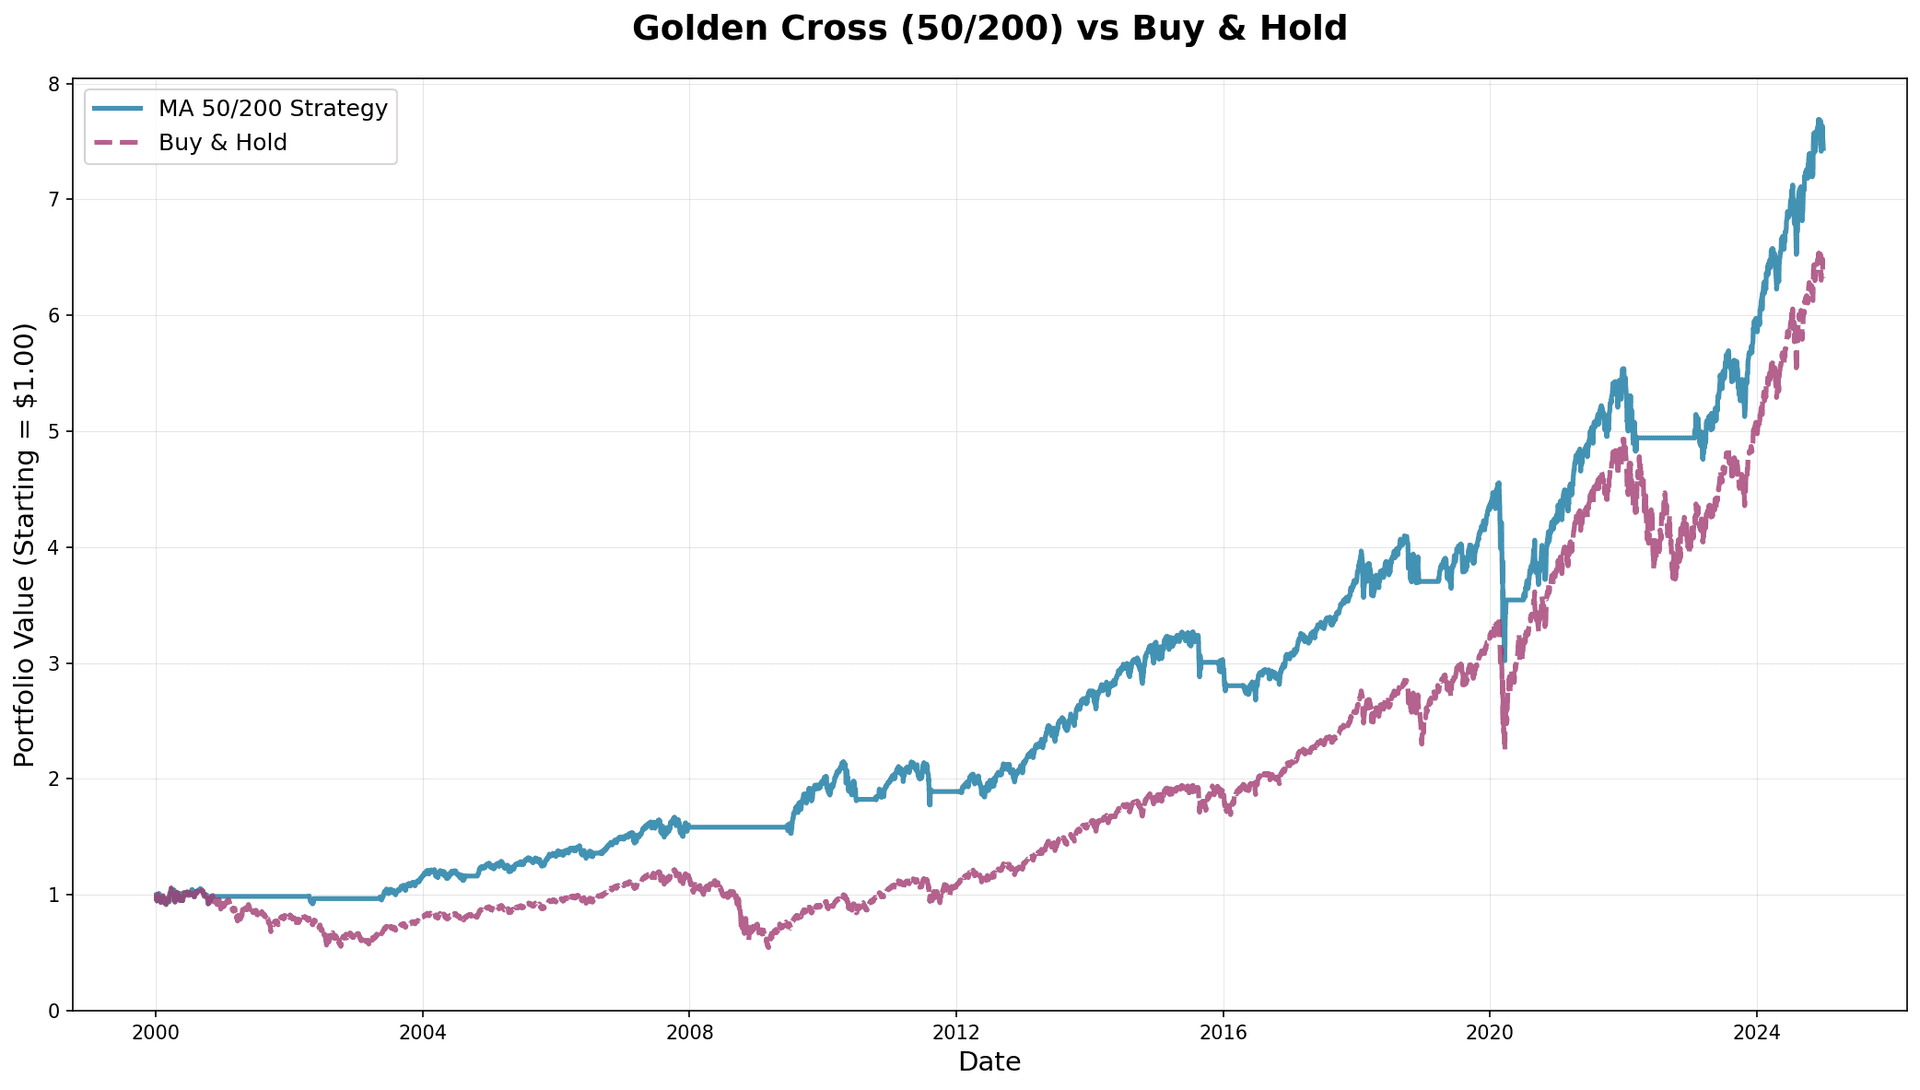
The strategy (blue) moves parallel to buy-and-hold (purple) when invested, and stays flat when in cash. Notice it sidestepped the 2000-2002 crash and 2008 crisis.
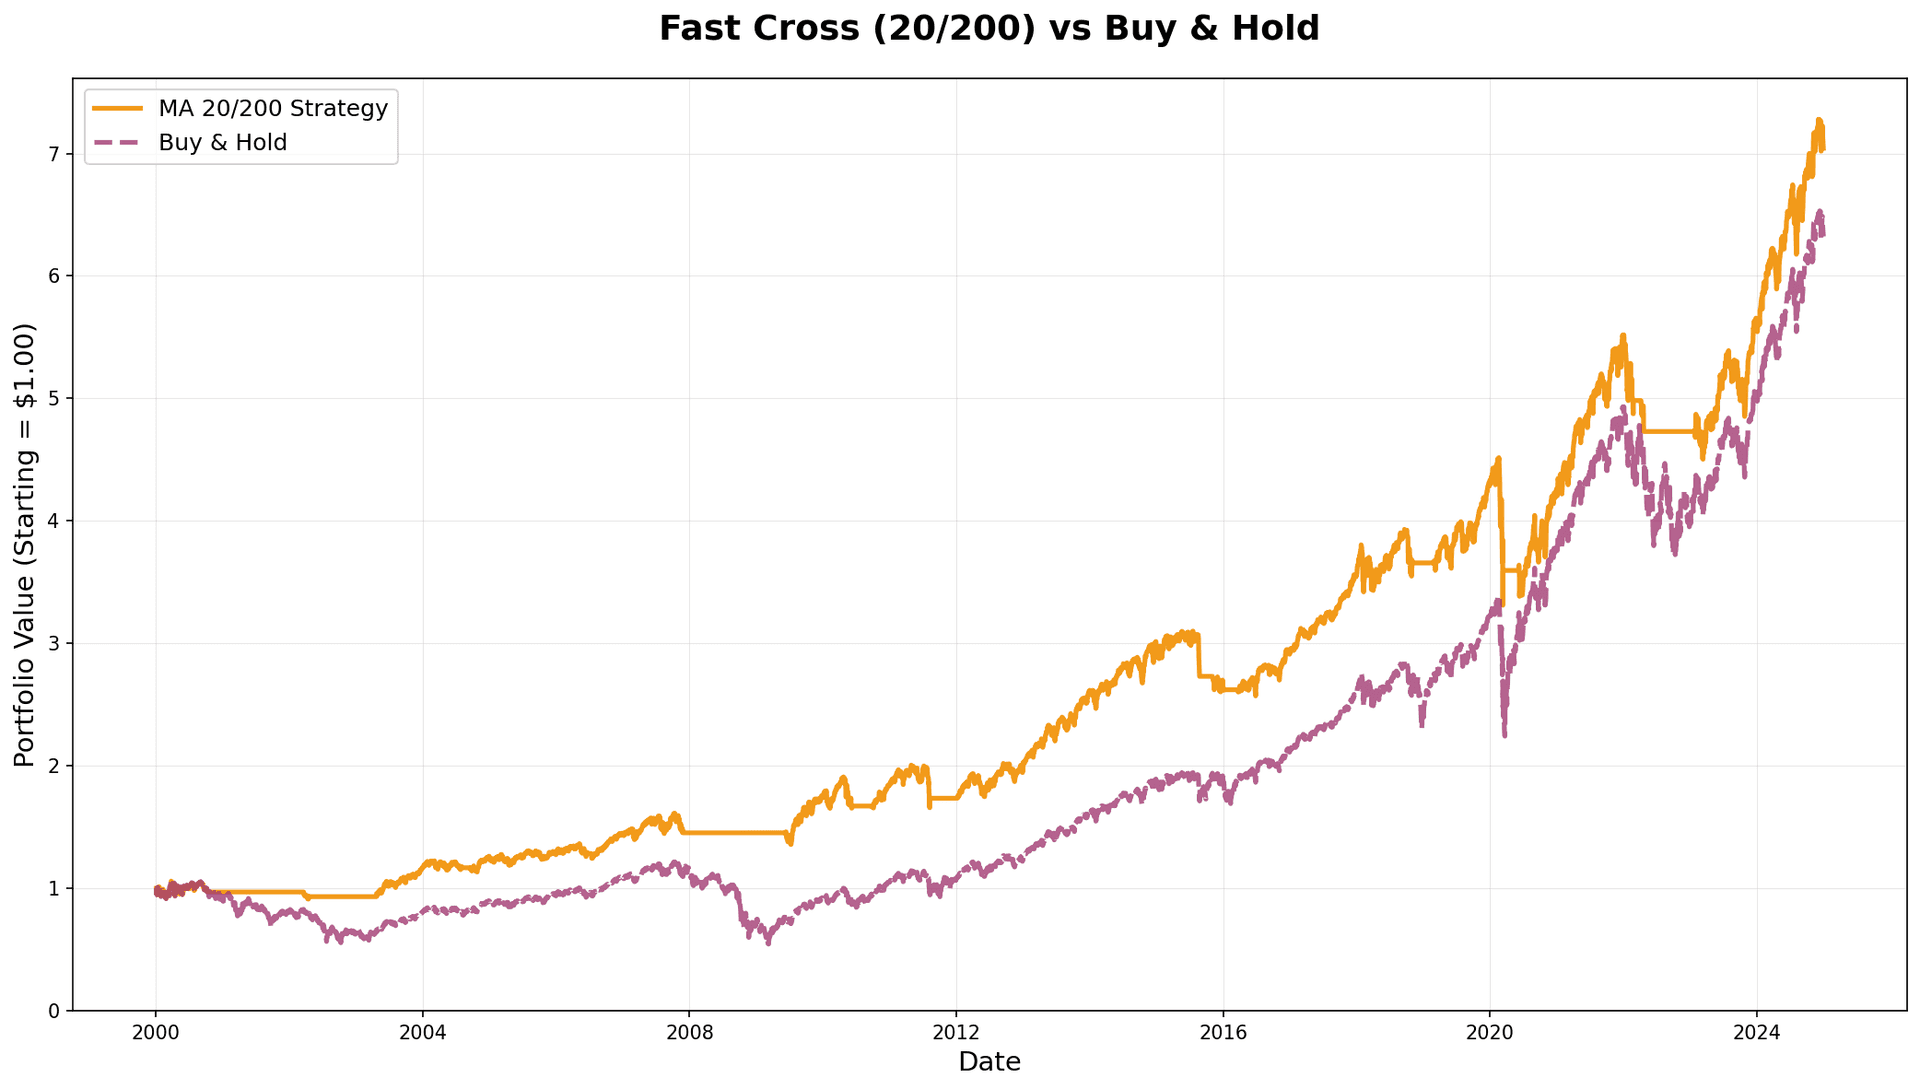
The Fast Cross (20/200)
Using a faster 20-day MA generates more signals.
Results on SPY (2000-2025):
| Metric | Value |
|---|---|
| Total Trades | 18 |
| Average Return per Trade | 12.38% |
| Win Rate | 55.6% |
| Total Return | 604.26% |
More trades (18 vs 12) with a 604% return - still outperforming buy-and-hold, but trailing the Golden Cross.
Testing Every Combination (10 to 200)
I tested every combination from 10 to 200 in steps of 10: 190 valid strategies.
The Full Landscape
Here's every strategy visualized. Gray lines show all 190 combinations, with the top 3 and buy-and-hold highlighted:
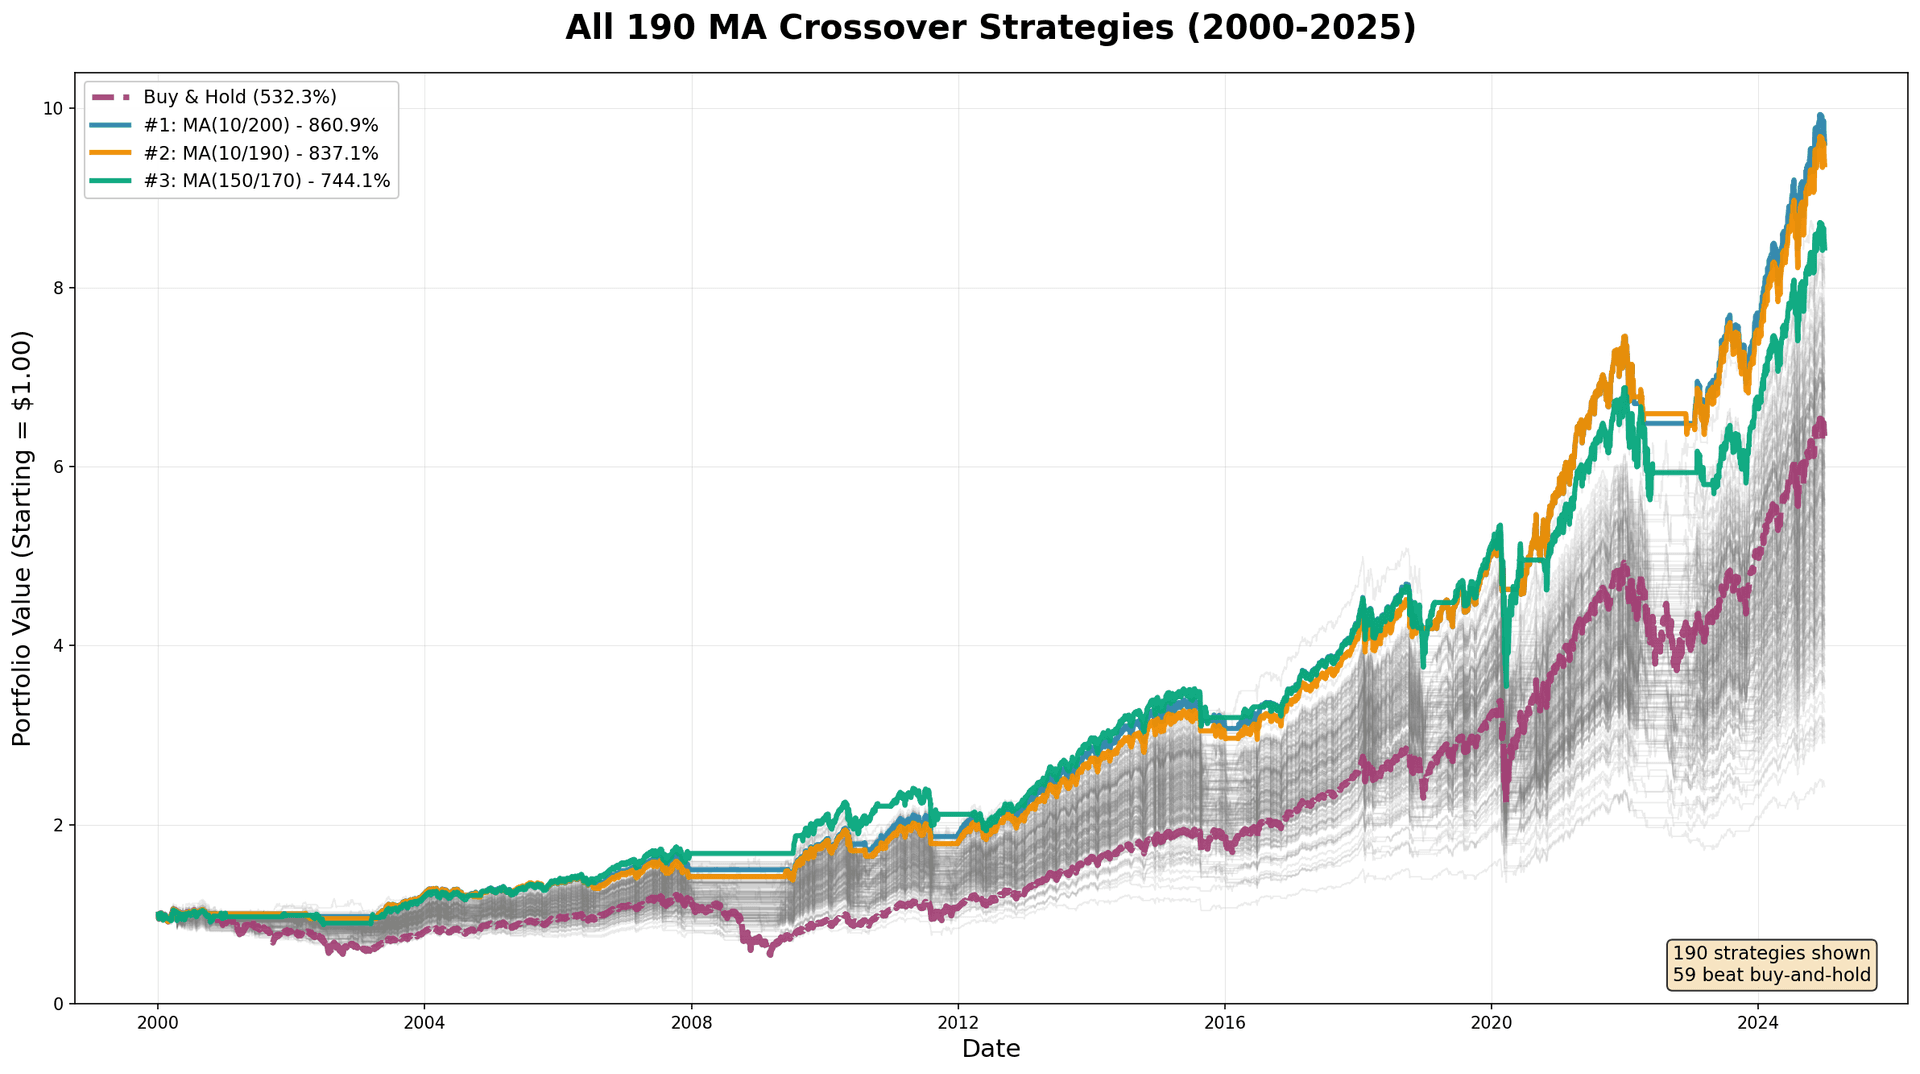
Key insight: Most strategies cluster near or below buy-and-hold (purple dashed line). Only a minority beat it.
Top 10 Strategies by Total Return
| Rank | Fast/Slow MA | Total Return | Trades | Avg Return/Trade |
|---|---|---|---|---|
| 1 | 10/200 | 860.90% | 22 | 10.60% |
| 2 | 10/190 | 837.05% | 27 | 8.73% |
| 3 | 150/170 | 744.05% | 24 | 9.85% |
| 4 | 10/20 | 733.70% | 155 | 0.58% |
| 5 | 10/170 | 719.58% | 33 | 6.35% |
| 6 | 10/180 | 710.66% | 28 | 7.90% |
| 7 | 110/120 | 704.55% | 42 | 5.88% |
| 8 | 30/200 | 700.98% | 12 | 19.90% |
| 9 | 20/190 | 680.49% | 16 | 14.18% |
| 10 | 110/170 | 668.24% | 13 | 17.60% |
The top performer (10/200) used a very fast 10-day MA with the 200-day, generating 861% return. The 10-day MA appears in 5 of the top 10 strategies.
The famous 50/200 Golden Cross ranked 27th out of 190 with its 644% return - solid but far from optimal.
The Performance Landscape: 3D Visualization
The 3D surface shows total return across all combinations. The gray plane is buy-and-hold (532%). Most of the surface sits below it.
Heatmaps: Detailed Analysis
Total Return:
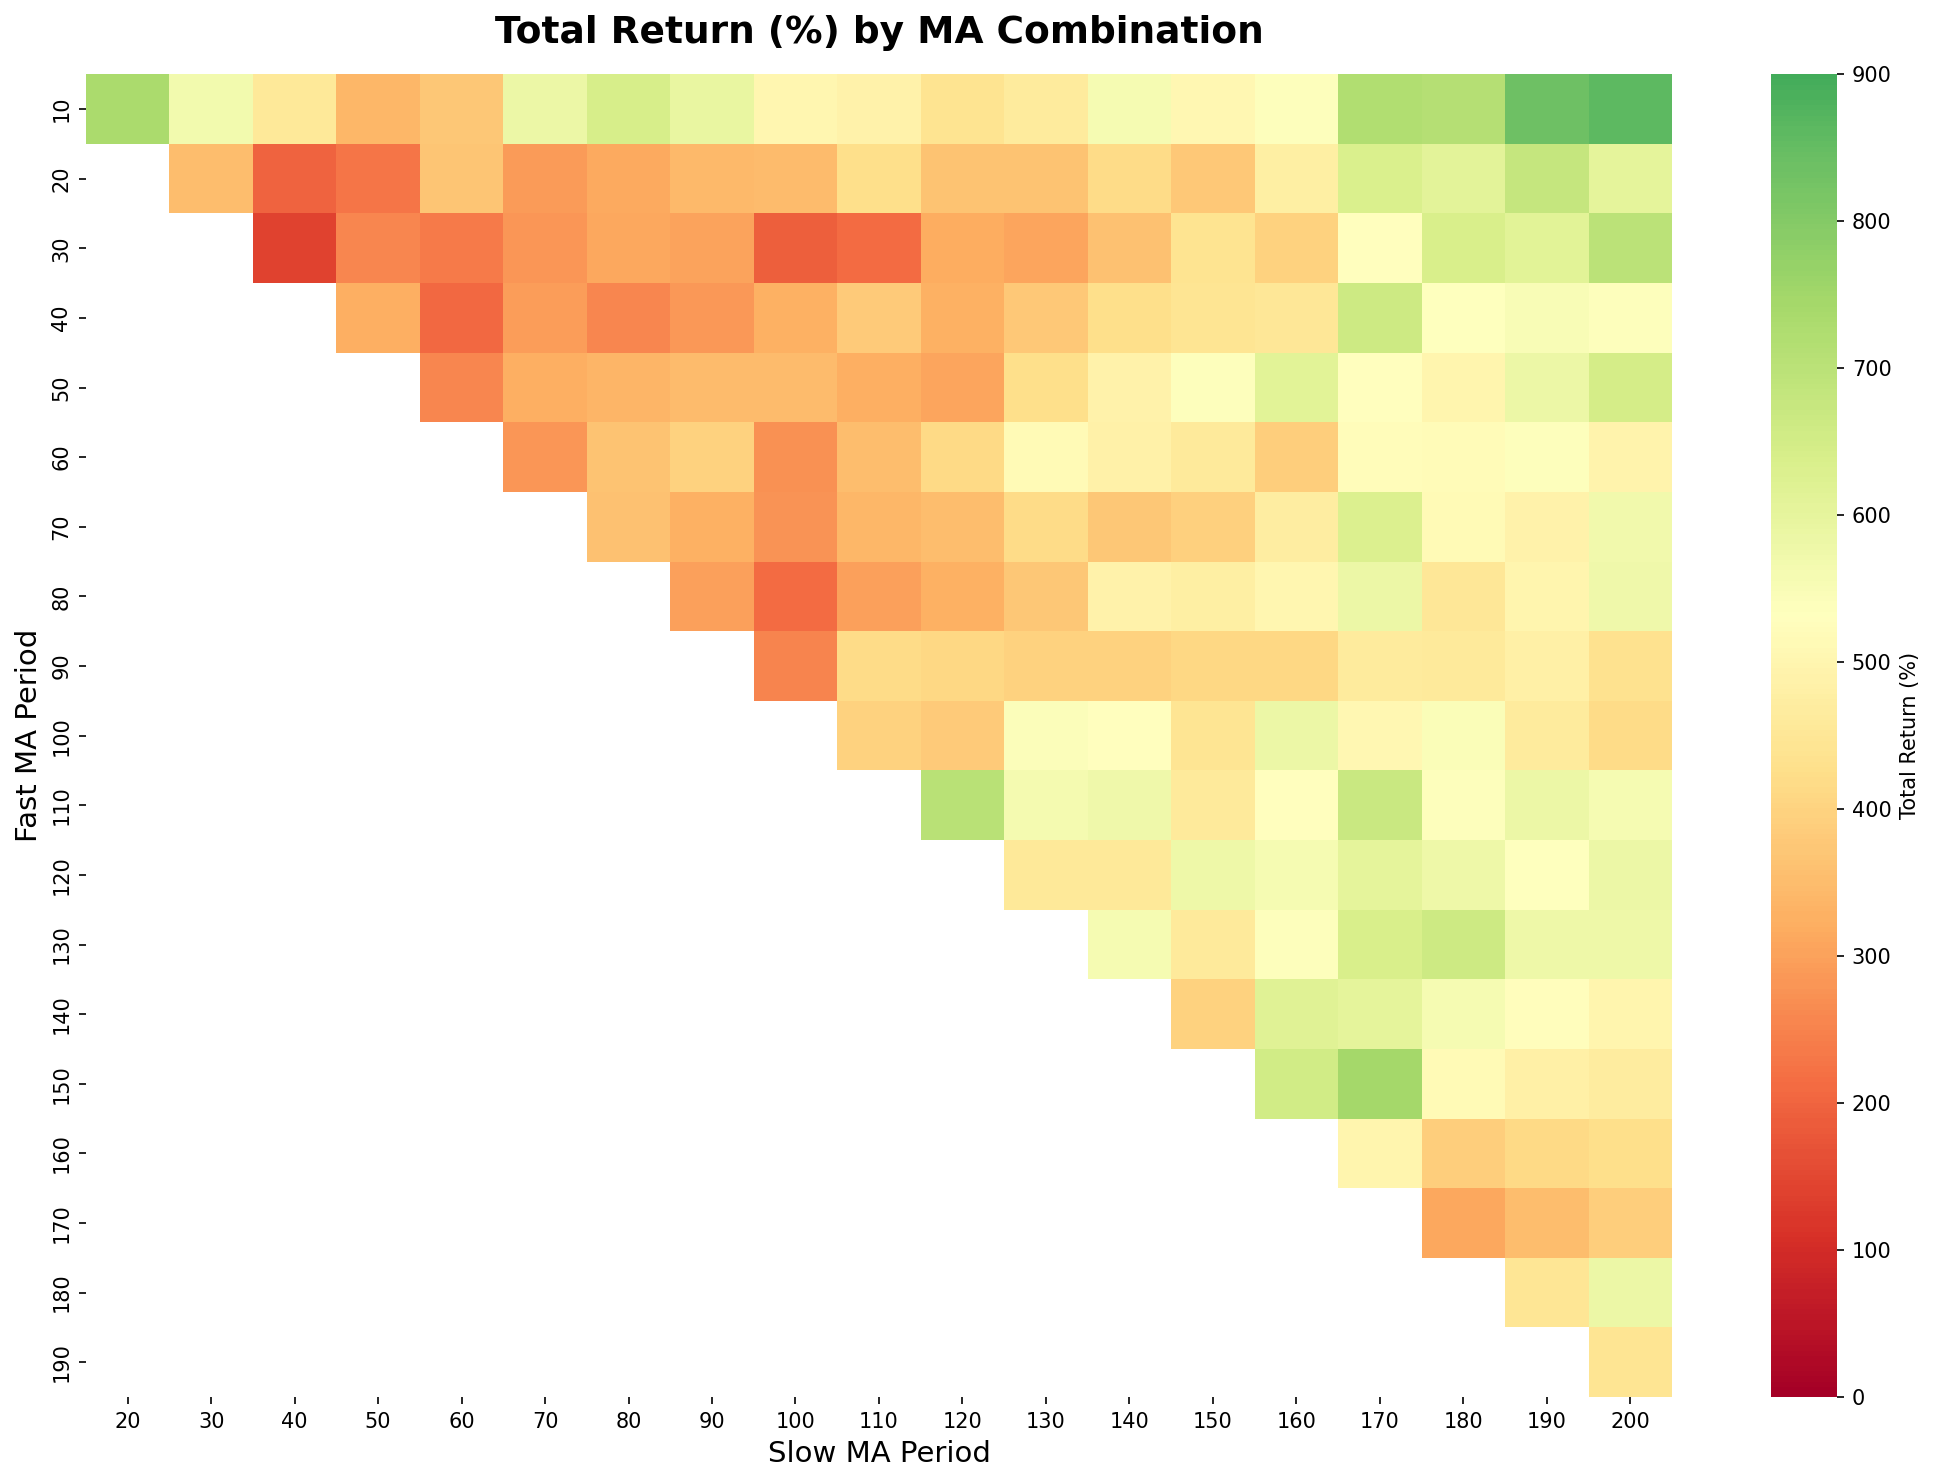
Bright green regions show high performance. Top performers cluster in specific areas: very fast MAs (10-20) with very slow MAs (180-200), or close slow MAs (150/170).
Average Return per Trade:
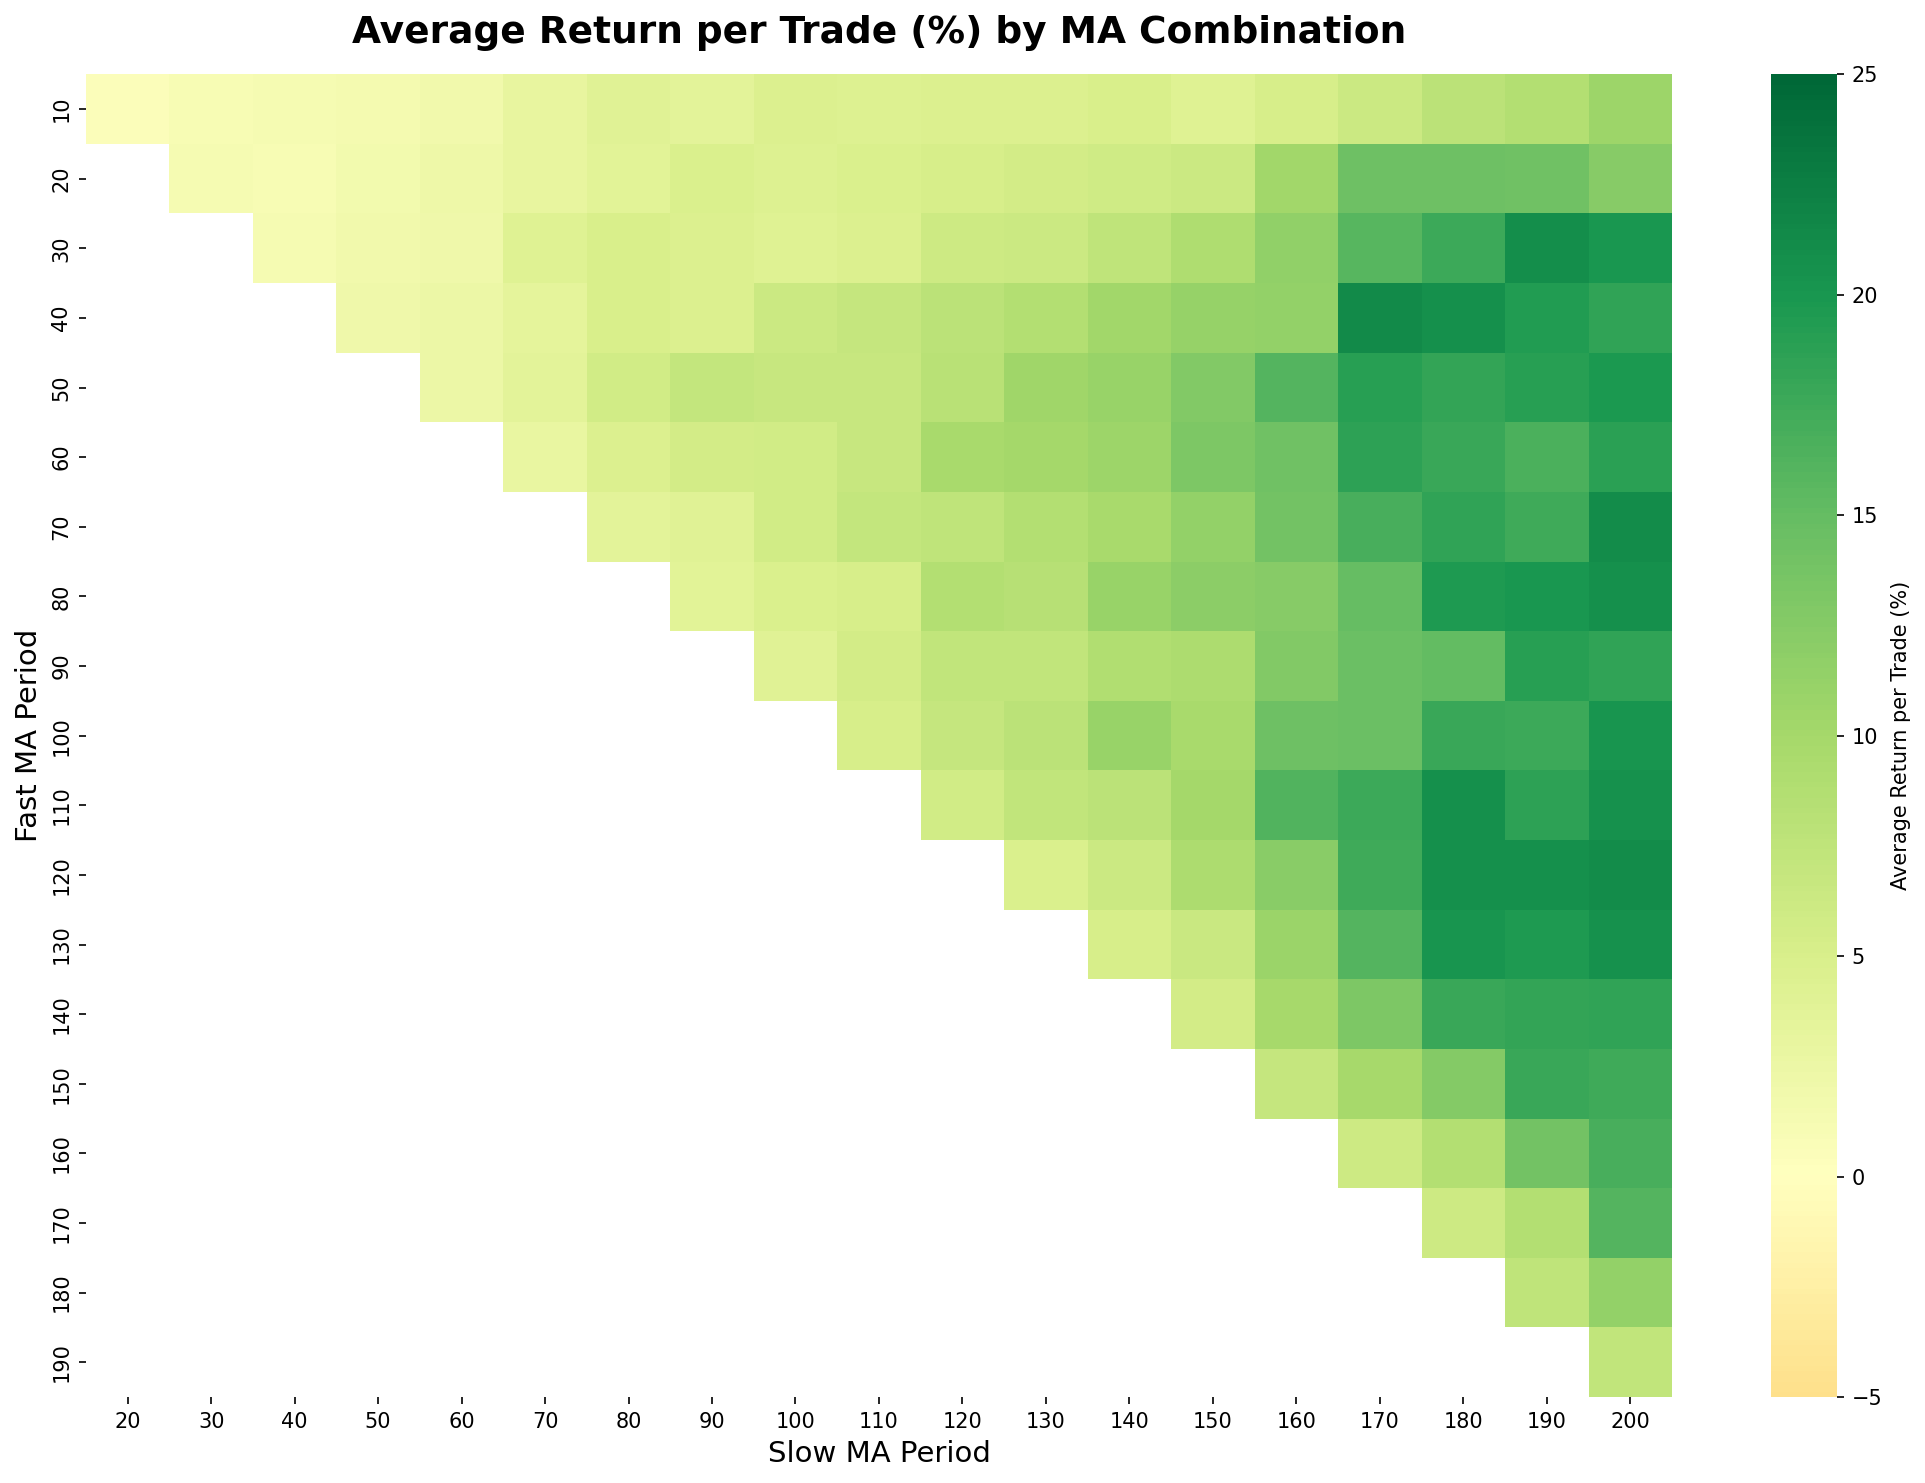
Strategies with widely-spaced MAs show better per-trade returns (20-25%), while high-frequency strategies average lower per-trade gains.
Number of Trades:
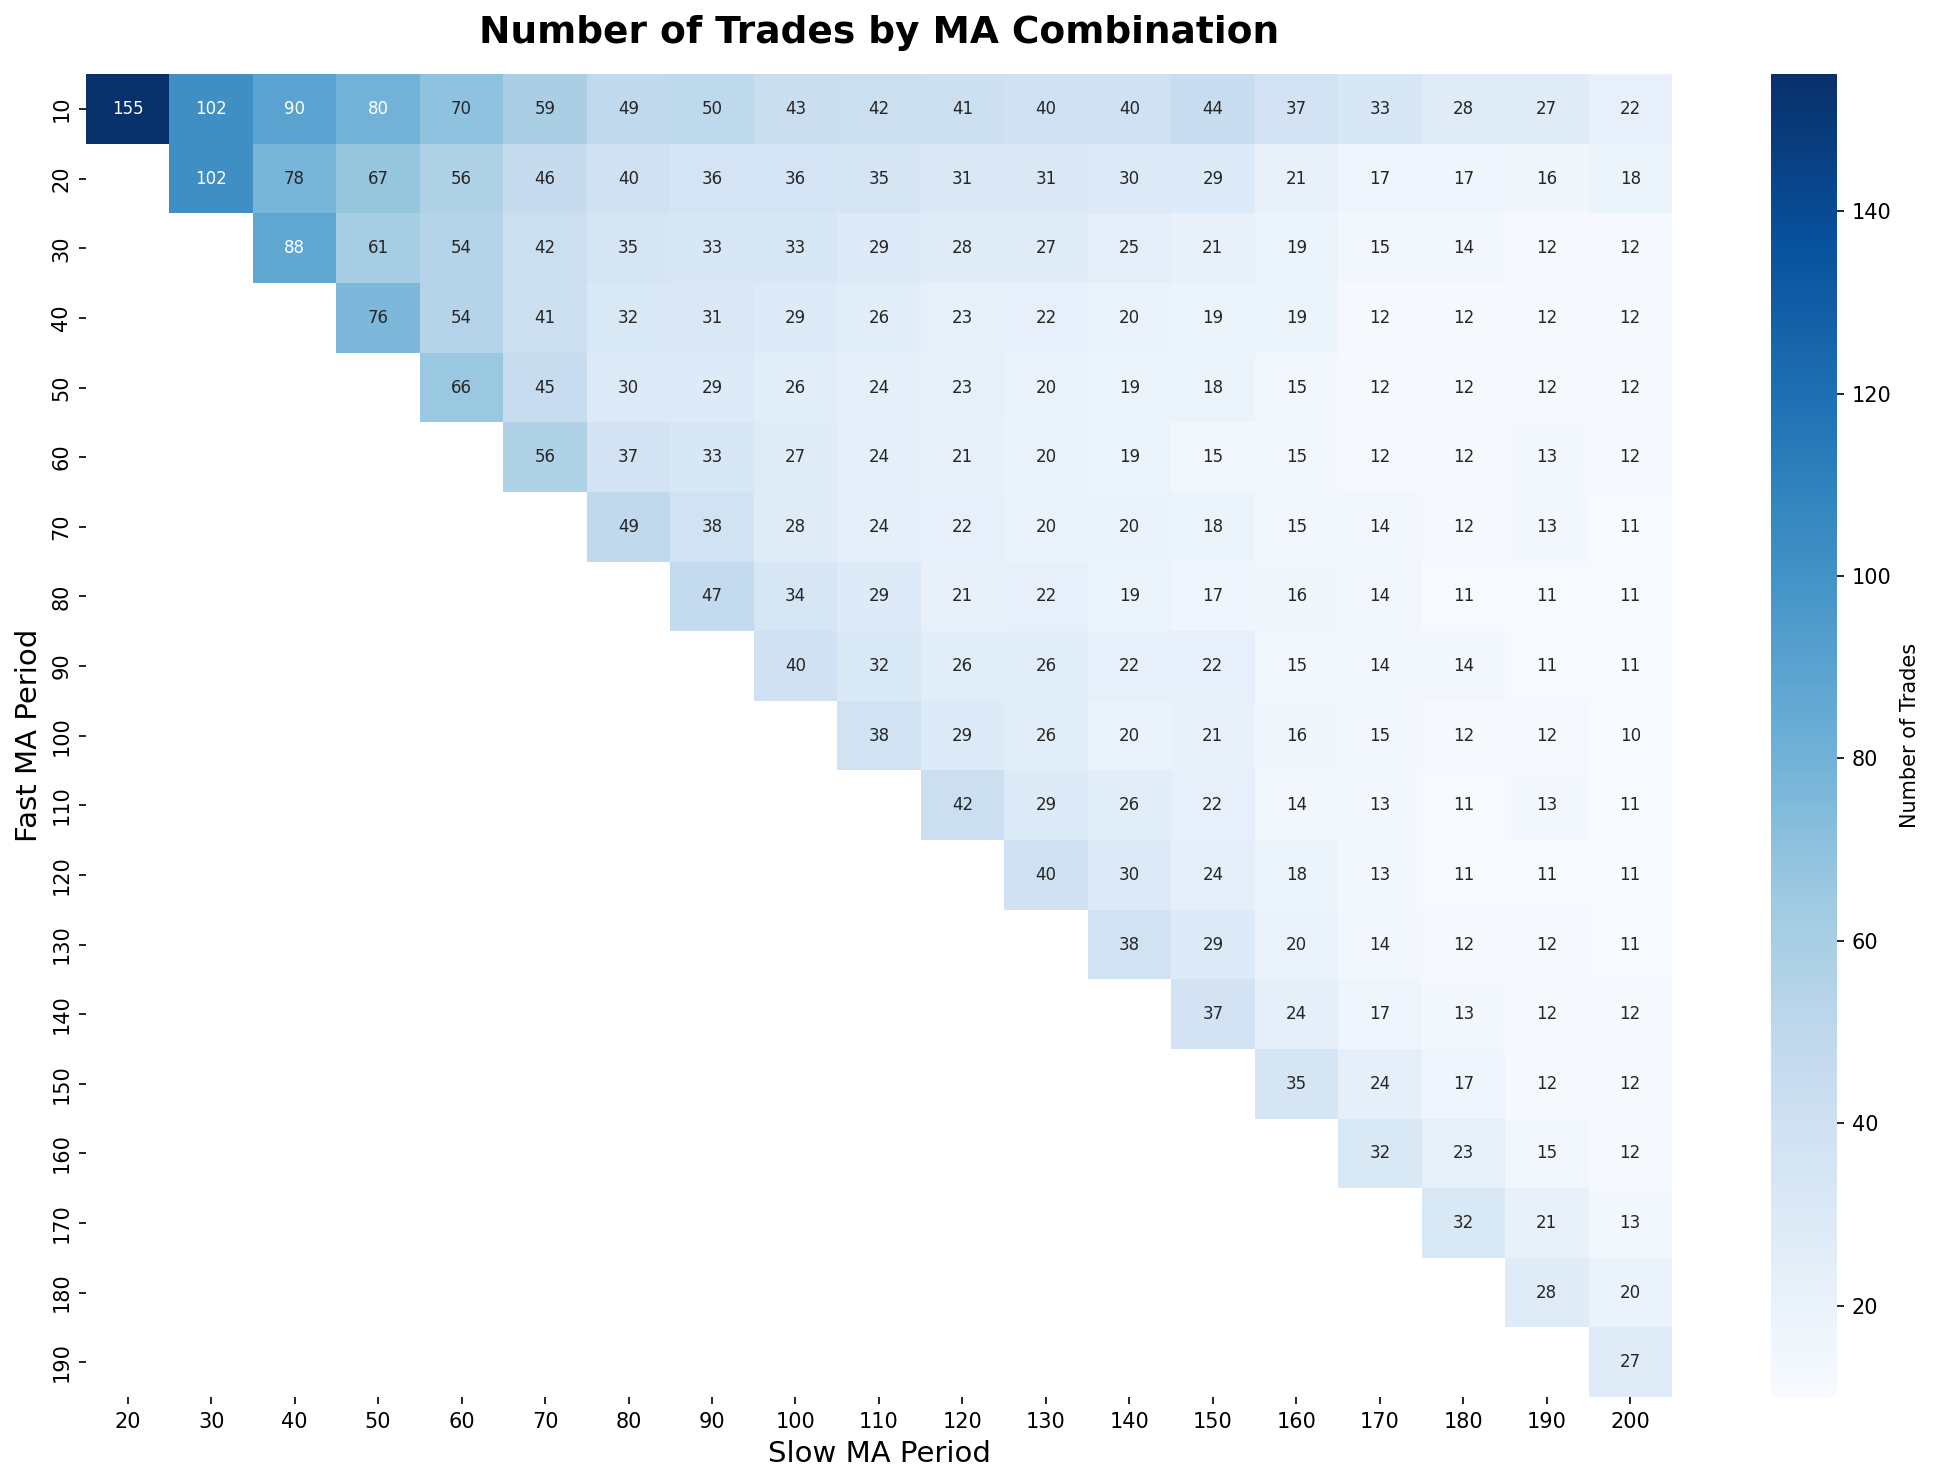
Trading frequency ranges from 7 trades (slowest) to 80+ (fastest) over 25 years.
Which Strategies Beat Buy-and-Hold?
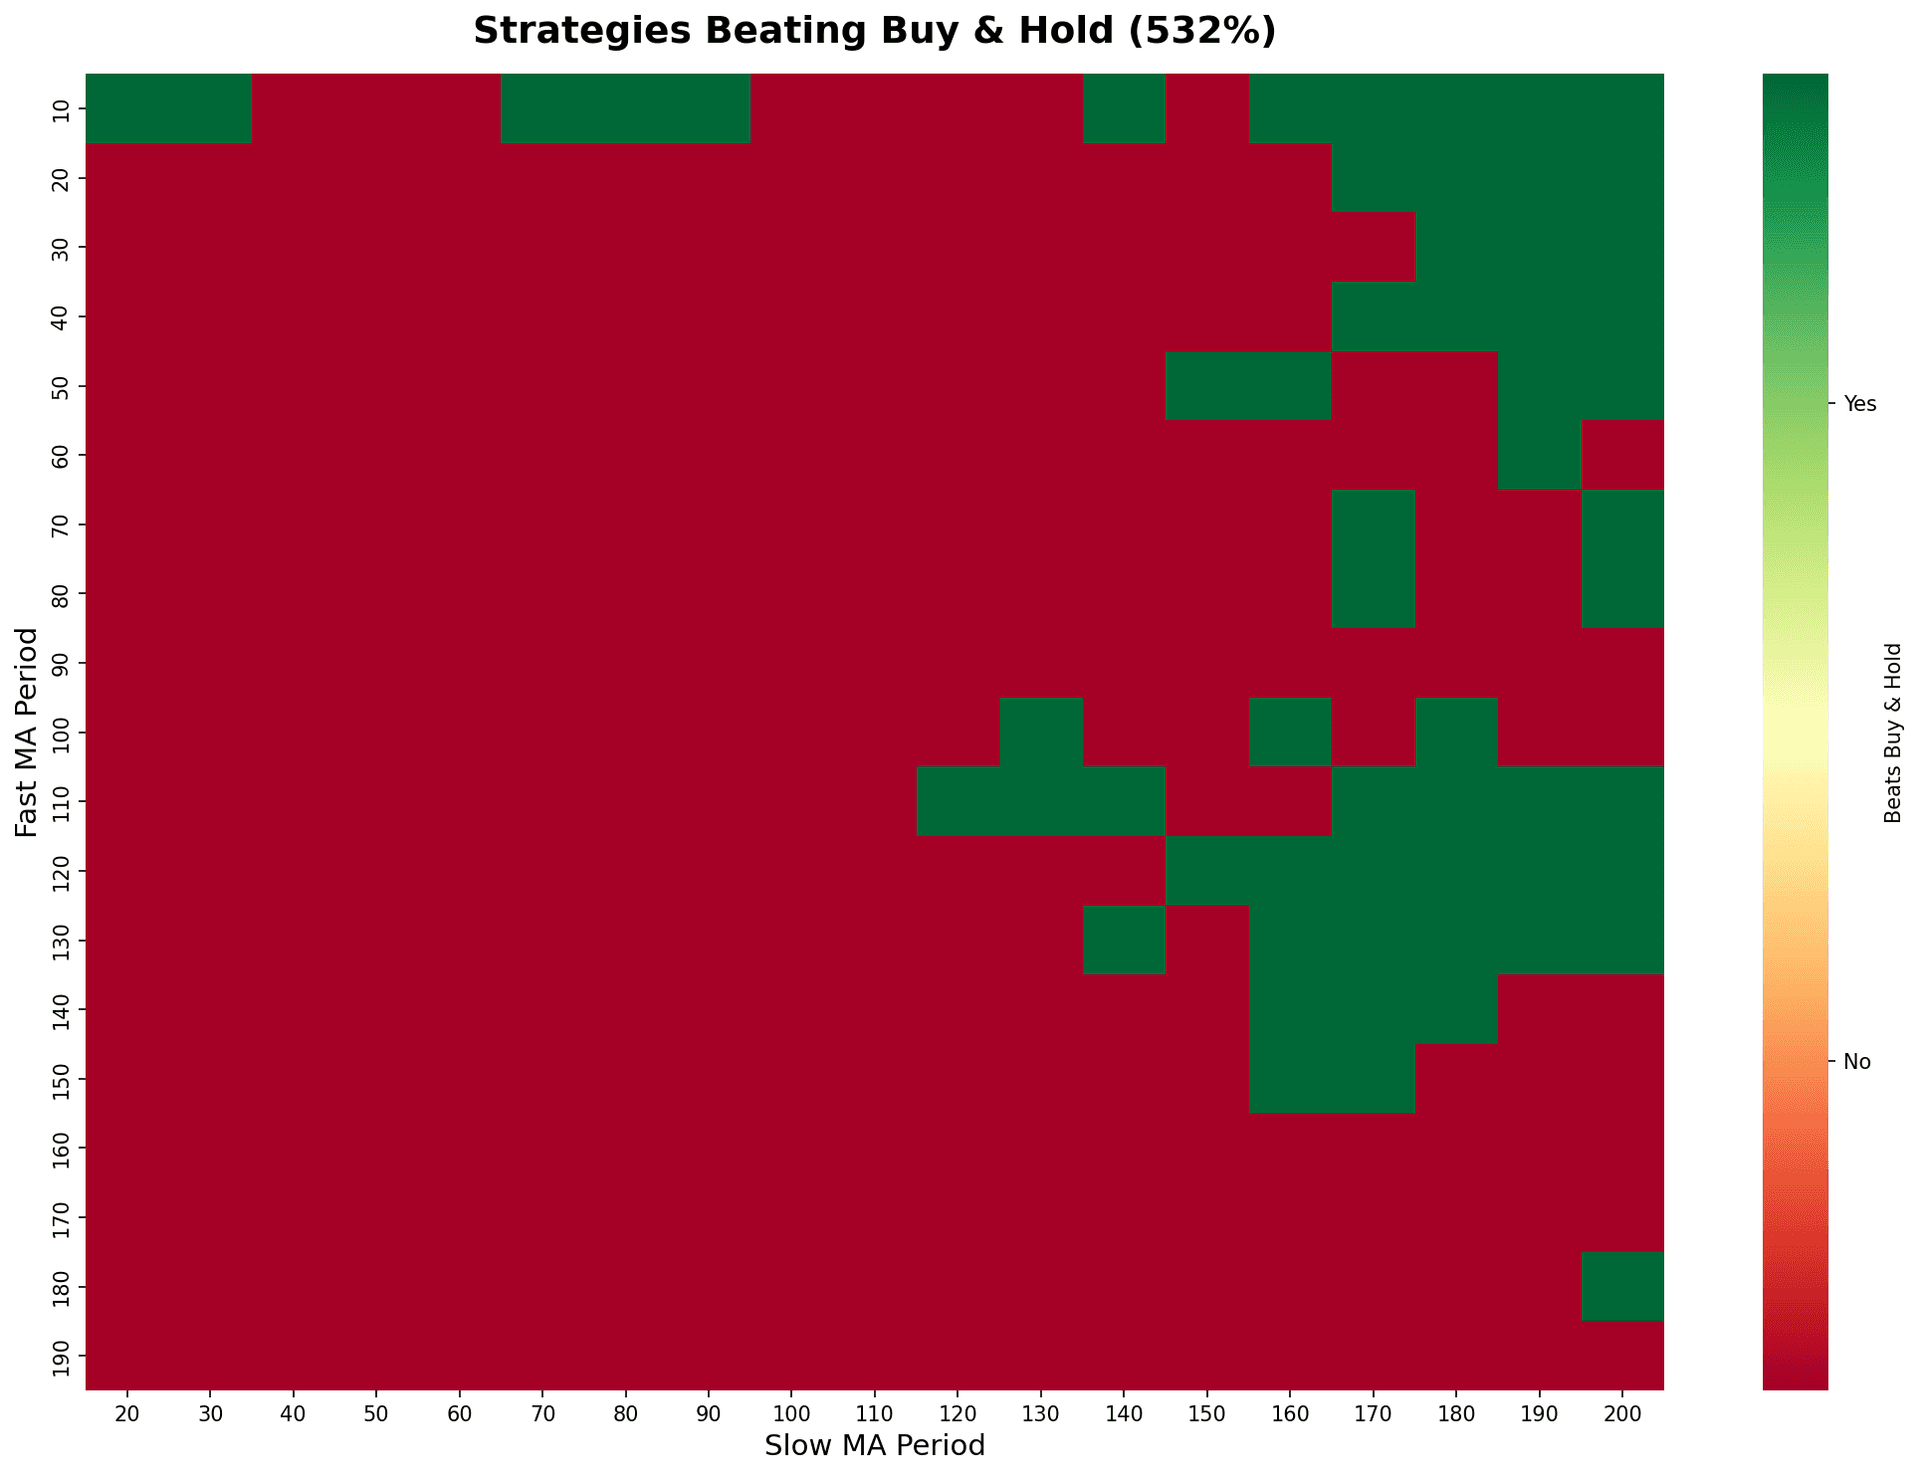
Green = beat buy-and-hold, Red = lost. Only 31.1% (59 out of 190) won. Winners cluster in specific regions - not random.
Return vs Trading Frequency:
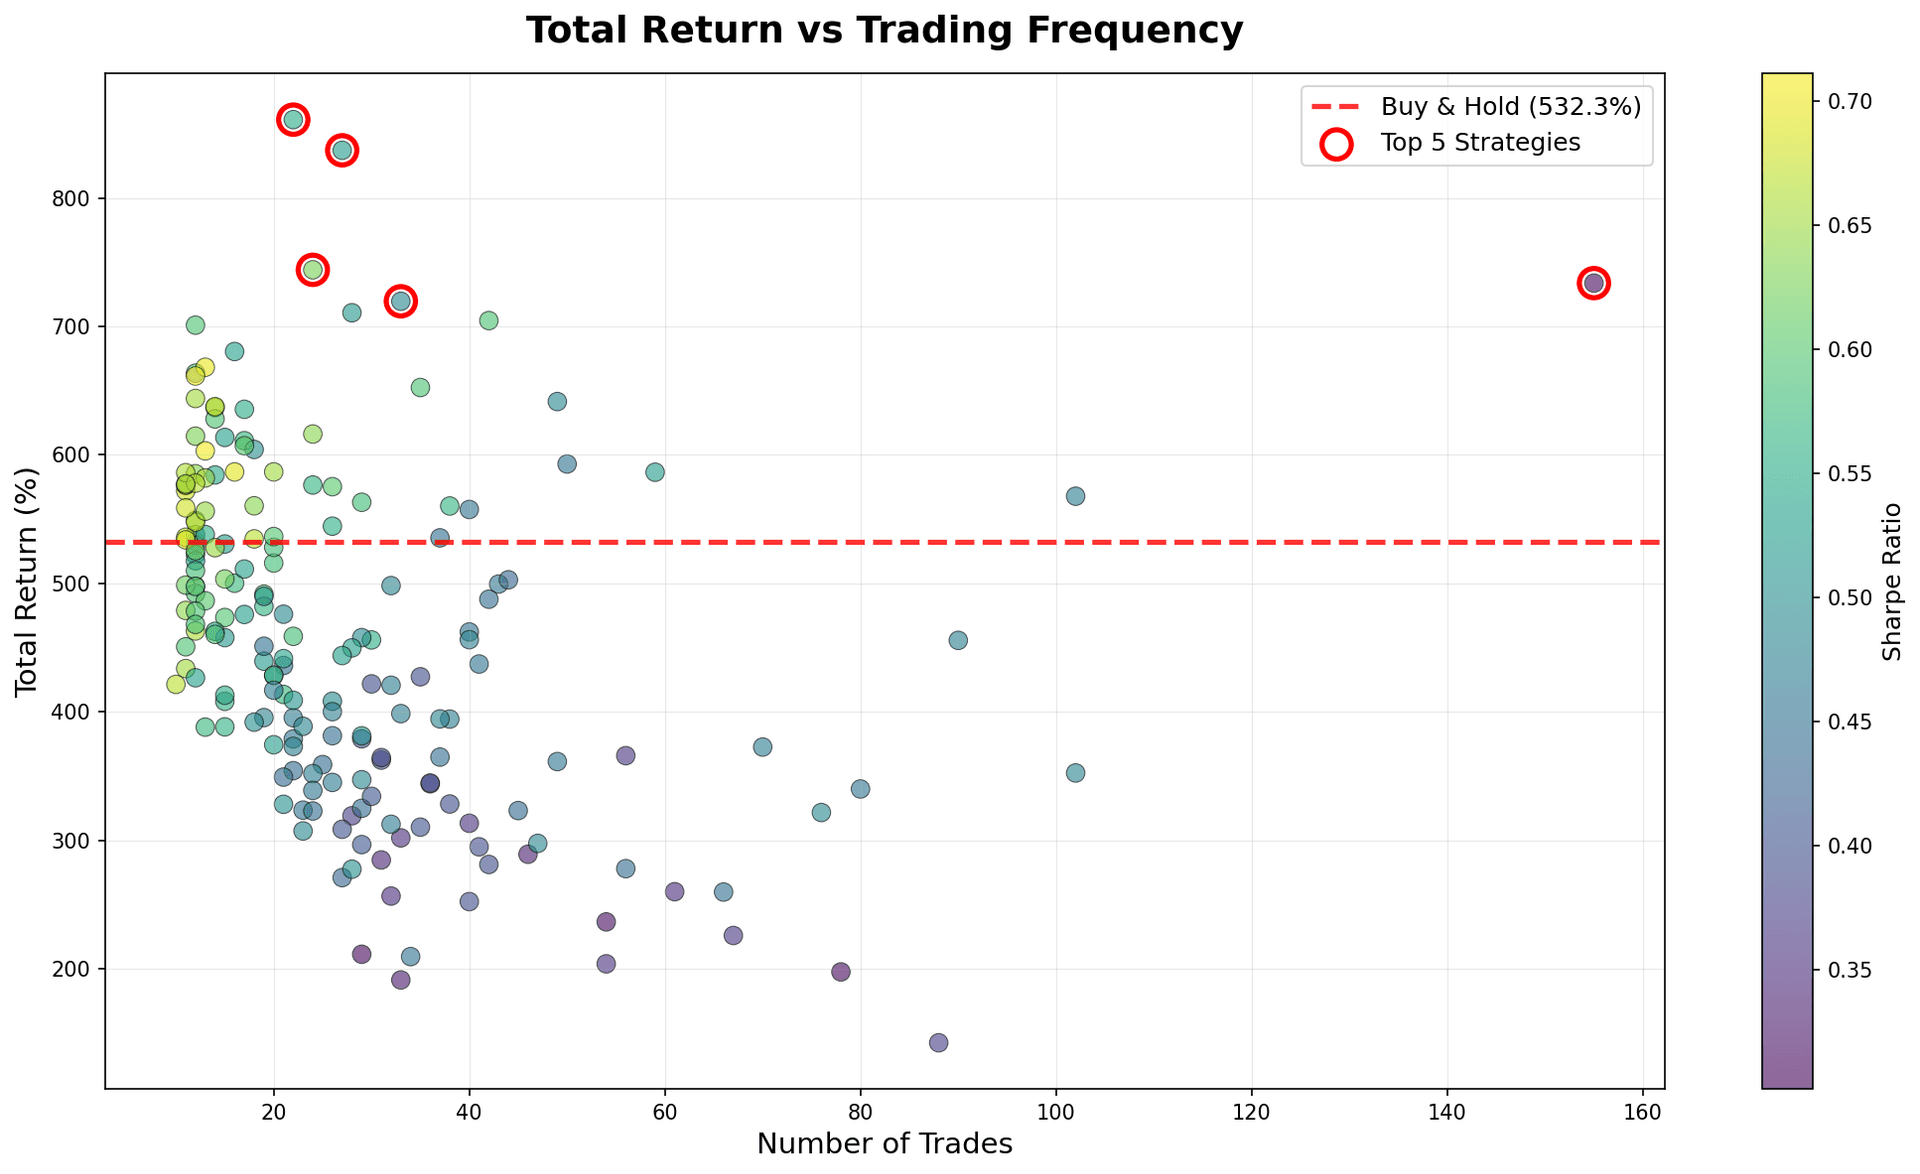
No correlation between trade count and returns. Top strategies (red circles) span different frequencies.
Key Findings
1. Most MA Crossovers Underperform Buy-and-Hold
Only 31.1% beat buy-and-hold (59 out of 190). If you randomly pick parameters, you're more than twice as likely to underperform.
2. Parameter Selection is Critical
Best strategy (10/200) returned 861%. The spread is enormous. But historical optimization doesn't guarantee future results.
3. Fast MAs Work With Very Slow MAs
The 10-day MA dominated top results when paired with very slow MAs (170-200). The spread matters more than absolute values.
4. More Trades ≠ Better Returns
No correlation between frequency and total return. Best strategies made 20-30 trades over 25 years.
5. The Golden Cross is Solid But Not Optimal
The 50/200 performed well (644%, 75% win rate) but ranked only 27th. Its fame owes to round numbers and media coverage, not unique optimality.
6. Robust Regions Exist
Winners cluster in specific regions: very fast MAs (10-20) with very slow MAs (170-200), or close slow pairs (150/170). This clustering suggests signal, not pure noise.
Practical Implications
For Active Traders:
- Avoid close MA combinations (fast ≈ slow) - they whipsaw
- Consider wide spreads: very fast (10-20) with very slow (180-200)
- Accept moderate trading: 20-30 trades over decades
- Don't cherry-pick historical winners
For Passive Investors:
- Buy-and-hold beat 68.9% of strategies
- Zero effort, no timing risk, minimal costs
- Hard to beat
For Strategy Developers:
- Trend following can work (31% beat buy-and-hold)
- Parameter robustness matters more than optimization
- Forward testing is essential
The Overfitting Problem
Testing 190 strategies risks finding historical noise. If I told you "use MA(10/200)," that's curve-fitting.
The value is understanding patterns:
- How much variation exists (best: 861%, median: ~450%)
- What drives it (parameter spread and trade frequency)
- Where robust regions are (clustering patterns)
The only validation is forward testing - paper trade or live trade with small capital. Historical backtests generate ideas, not guarantees.
Conclusion
Moving average crossovers can work. The 50/200 Golden Cross generated 644% over 25 years with 12 trades and a 75% win rate.
But most strategies underperform buy-and-hold. Of 190 combinations, only 59 (31.1%) beat simple passive investing.
Parameter selection matters enormously. The best strategy hit 861% while many barely beat inflation.
The famous Golden Cross ranked 27th out of 190. It works, but its fame is partly luck (round numbers, media coverage).
For most investors: buy-and-hold is hard to beat. It requires no skill, no timing, no optimization, and beat more than two-thirds of MA cross strategies.
Want to test your own strategies? Try Backtest4U - backtest any combination of indicators on historical data.